Getting Started
Now that you have successfully installed Meltano locally or in the cloud, you're ready to start create your first project, connect data sources, build pipelines, perform analysis and create dashboards.
TIP
The following instructions assume you are able to access Meltano's user interface locally from http://localhost:5000 or at http://YOUR_CLOUD_IP_ADDRESS:5000.
Create your first project
To initialize a new project, open your terminal and navigate to the directory that you'd like to store your Meltano projects in.
Next, to create your project, you will use the meltano init command which takes a PROJECT_NAME that is of your own choosing. For this guide, let's create a project called "carbon."
Meltano shares anonymous usage data with the team through Google Analytics. This is used to help us learn about how Meltano is being used to ensure that we are making Meltano even more useful to our users.
If you would prefer to use Meltano without sending the team this data, learn how to configure this through our environment variables docs.
meltano init carbon
This will create a new directory named carbon in the current directory and initialize Meltano's basic directory structure inside it.
Inside the Meltano project directory, all plugin configuration (which may include tokens and passwords) is stored inside the .meltano directory,
which is automatically added to the project's .gitignore file to prevent this potentially sensitive information from accidentally being pushed up to a hosted Git repository.
Start the application
Now that you've created your first Meltano project, let's change directory to our new project and start Meltano UI:
cd carbon
meltano ui
Meltano is now running and should open a new tab at http://localhost:5000.
Connect a data source
You should see now see the Extractors page, which contains various options for connecting your data source.
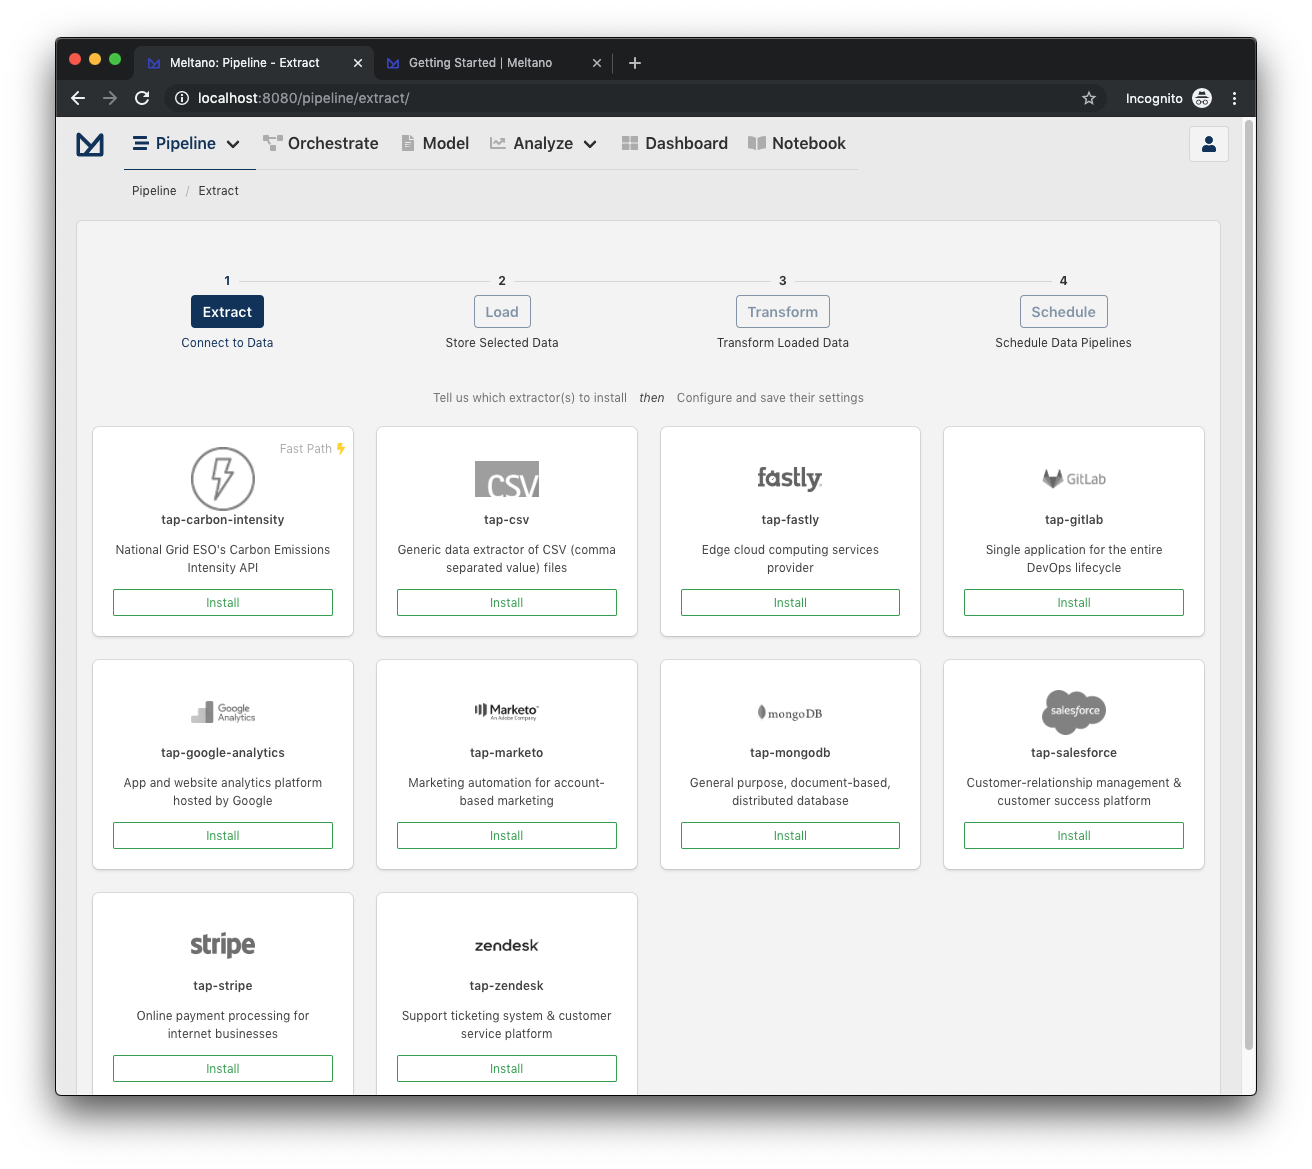
For this guide, we will be following the "Fast Path" to get you up and running as quickly as possible. So let's install tap-carbon-intensity by clicking on the Install button inside its card. While an Extractor is installed, you are presented with the following modal:
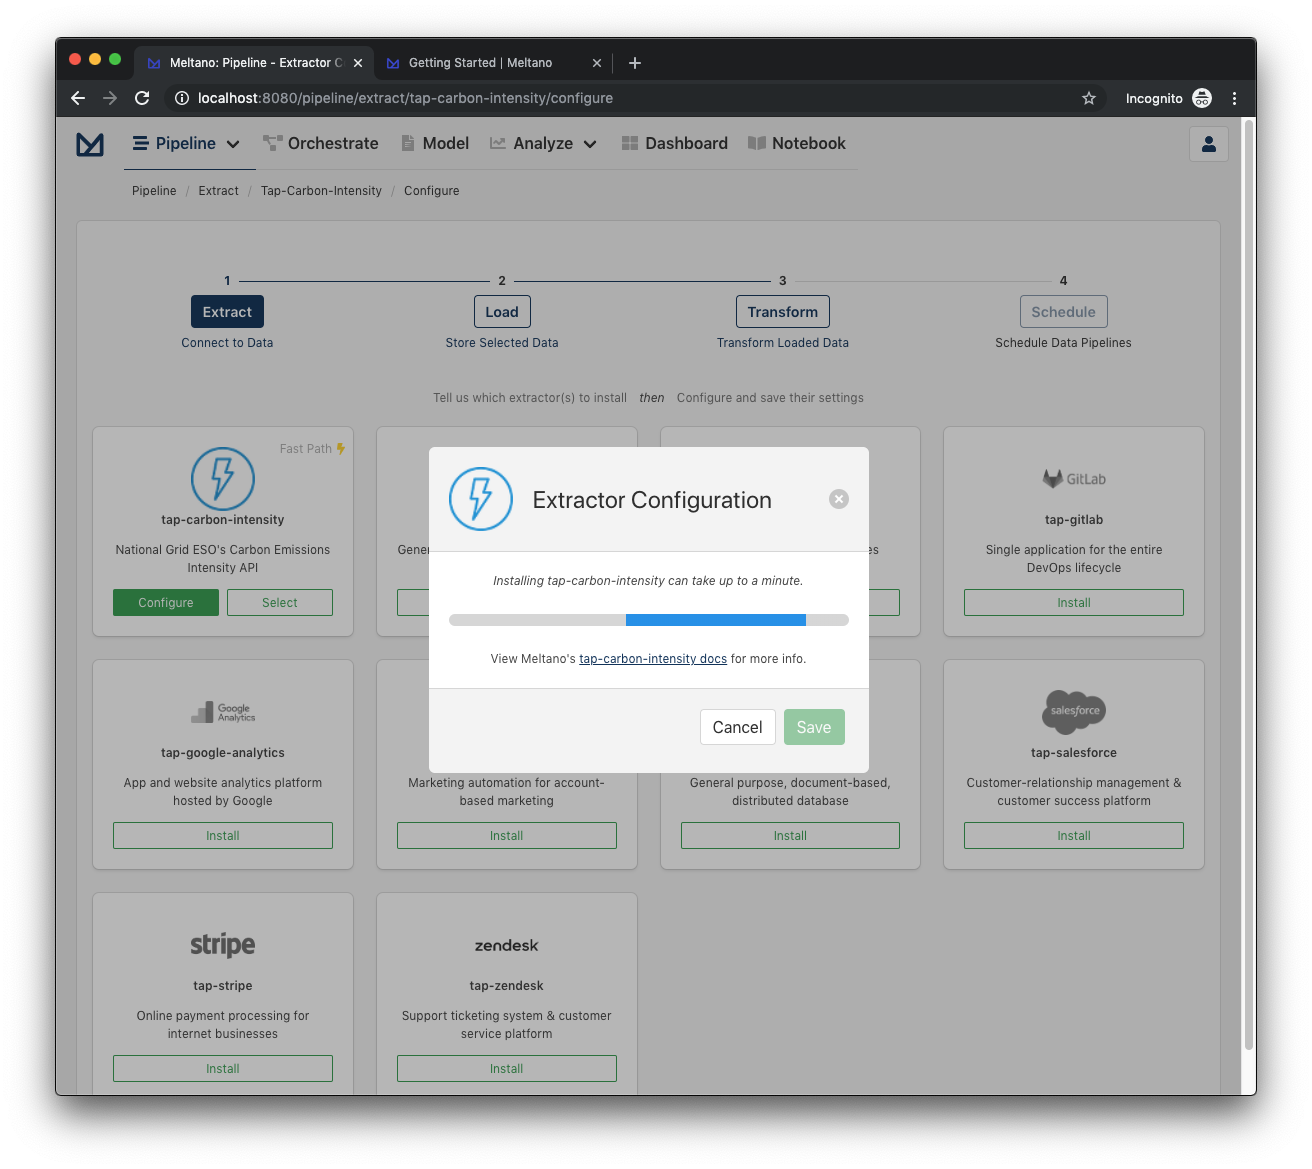
The tap-carbon-intensity Extractor does not require any configuration (like a username or password). Once the installation is complete, you will progress to the next step: "Load".
Determine where the data will live
Once you've setup your Extractor, you will be greeted with the Loaders page:
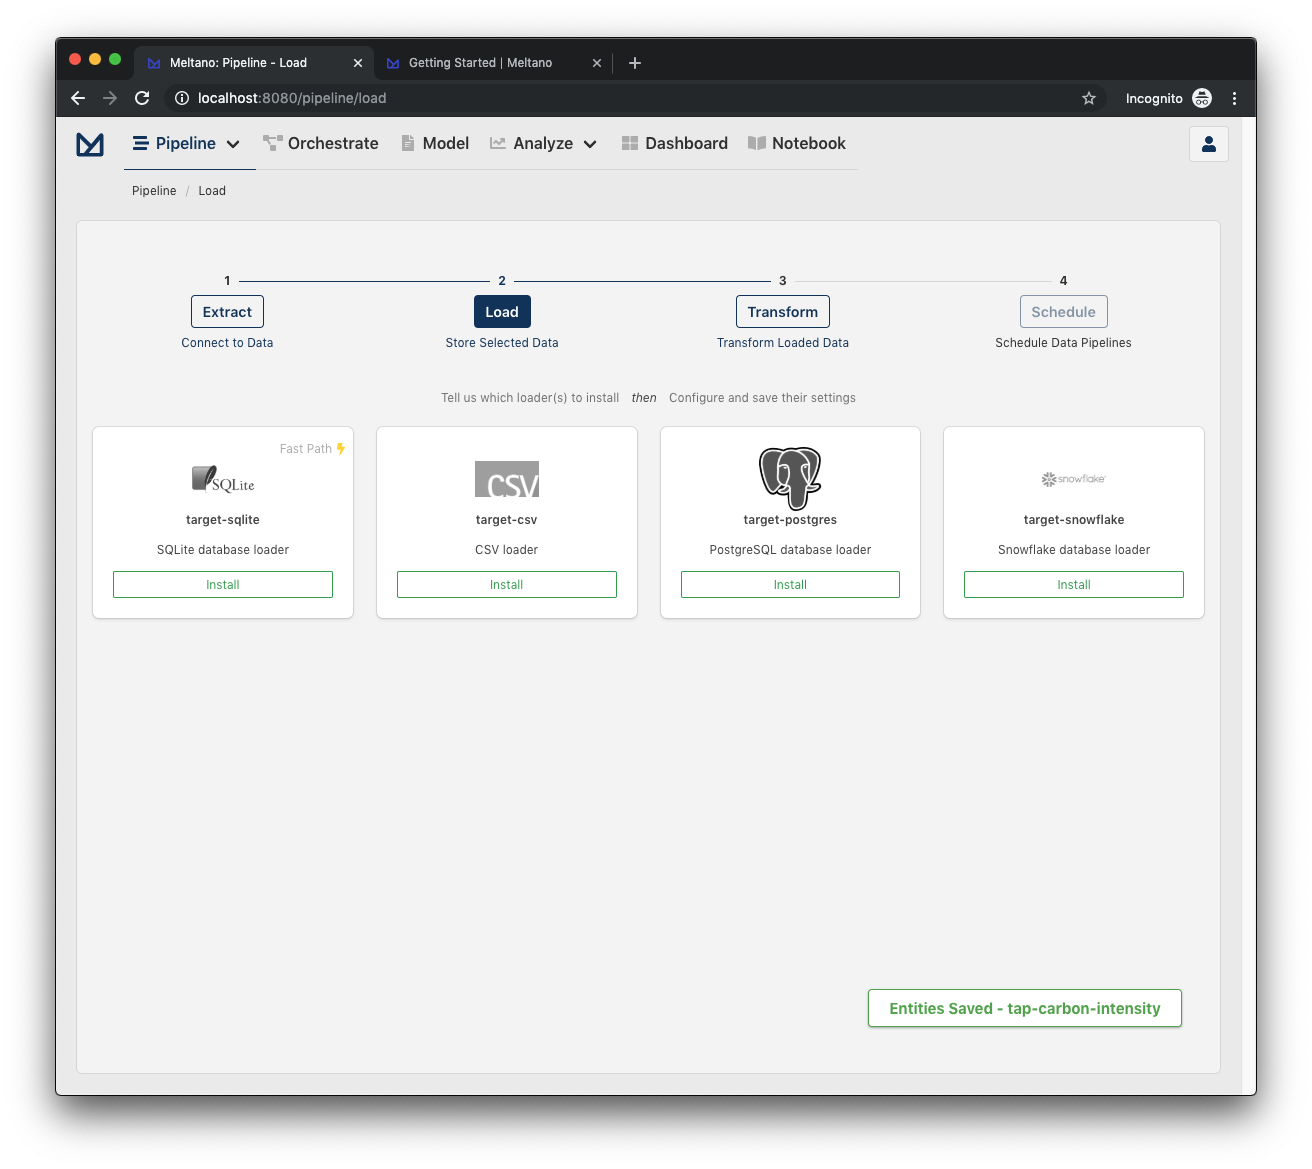
Now that Meltano is pulling data in from your data source(s), you need to choose where and in what format you would like that data stored.
Let's use target-sqlite for this project by clicking Install in its card.
Once it is finished installing, you will see the following modal:
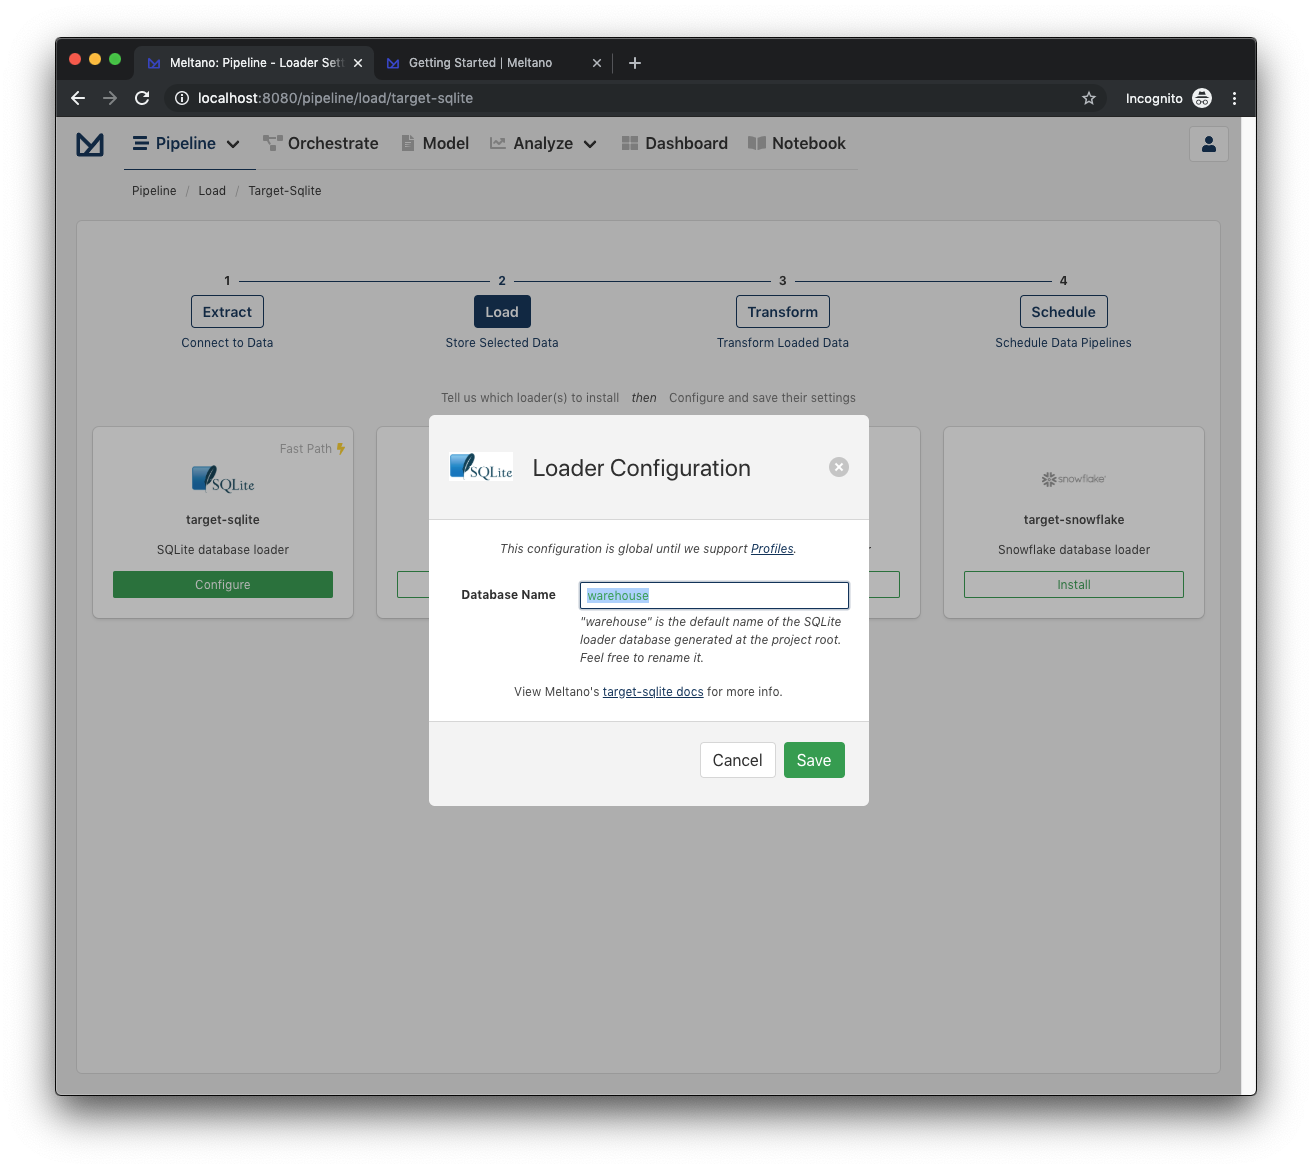
By default, target-sqlite is configured with a database named warehouse that can be customized if desired. For this guide however, let's just use the default name and click Save.
Apply transformations as desired
With our extractor and loader configured, you should now see the following page:
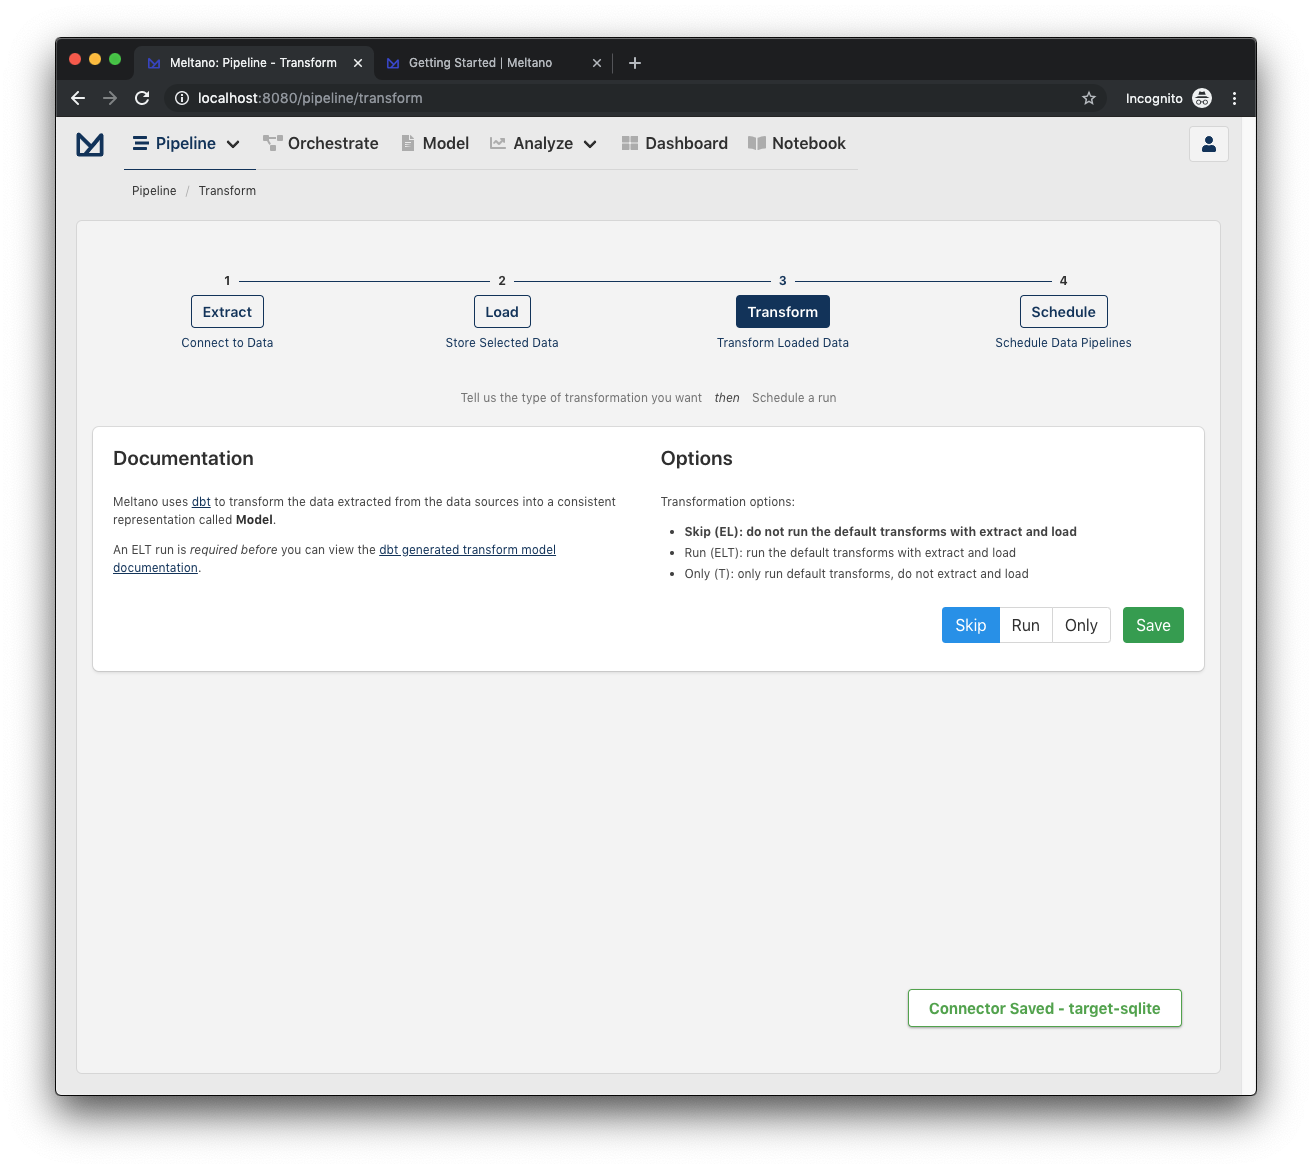
This page allows you to apply transformations to your data. This is not necessary for our current setup, but if you'd like to learn more about how transformations work in Meltano, check out our documentation on Meltano Transformations.
By default, the Transform step is set to Skip, so all we need to is click Save.
Create a pipeline schedule
You should now be greeted with the Schedules page with a modal to create your first pipeline!
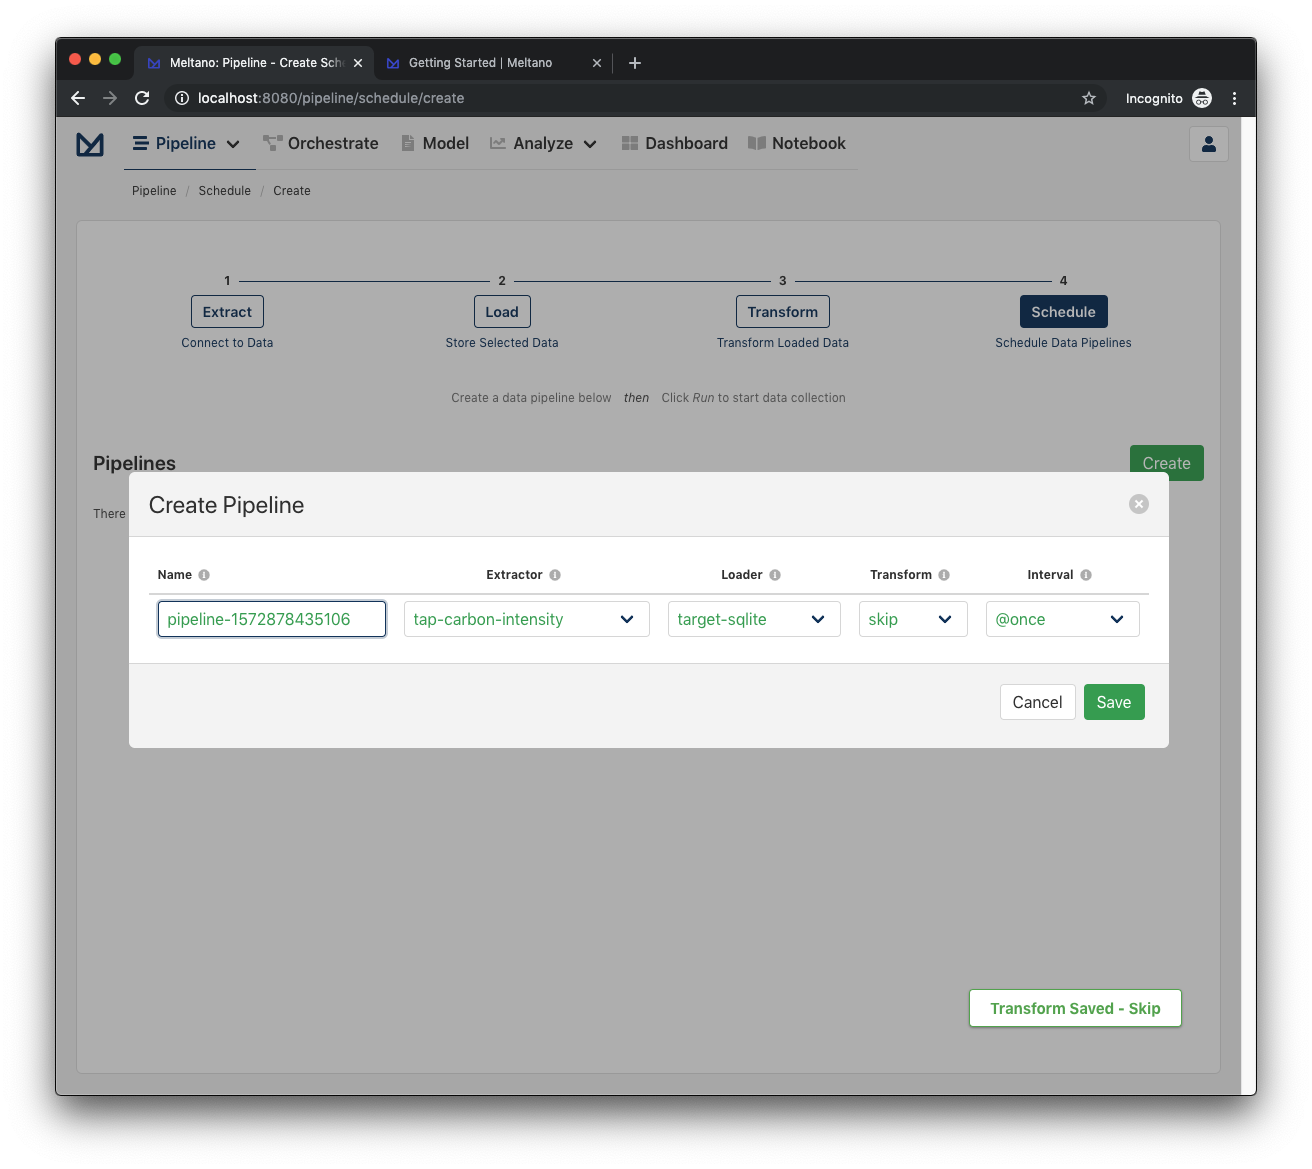
Meltano provides Orchestration using Apache Airflow, which allows you to create scheduled tasks to run pipelines automatically. For example, you may want a recurring task that updates the database at the end of every business day.
In the current form, you will see:
- A pipeline name which has a default name that is dynamically generated, but can be easily changed if desired
- The extractor the pipeline will use, which should be
tap-carbon-intensity - The loader the pipeline will use, which should be
target-sqlite - Whether the transform step should be applied, which should be
skip - The interval at which the pipeline should be run, which is set by default to be
@once
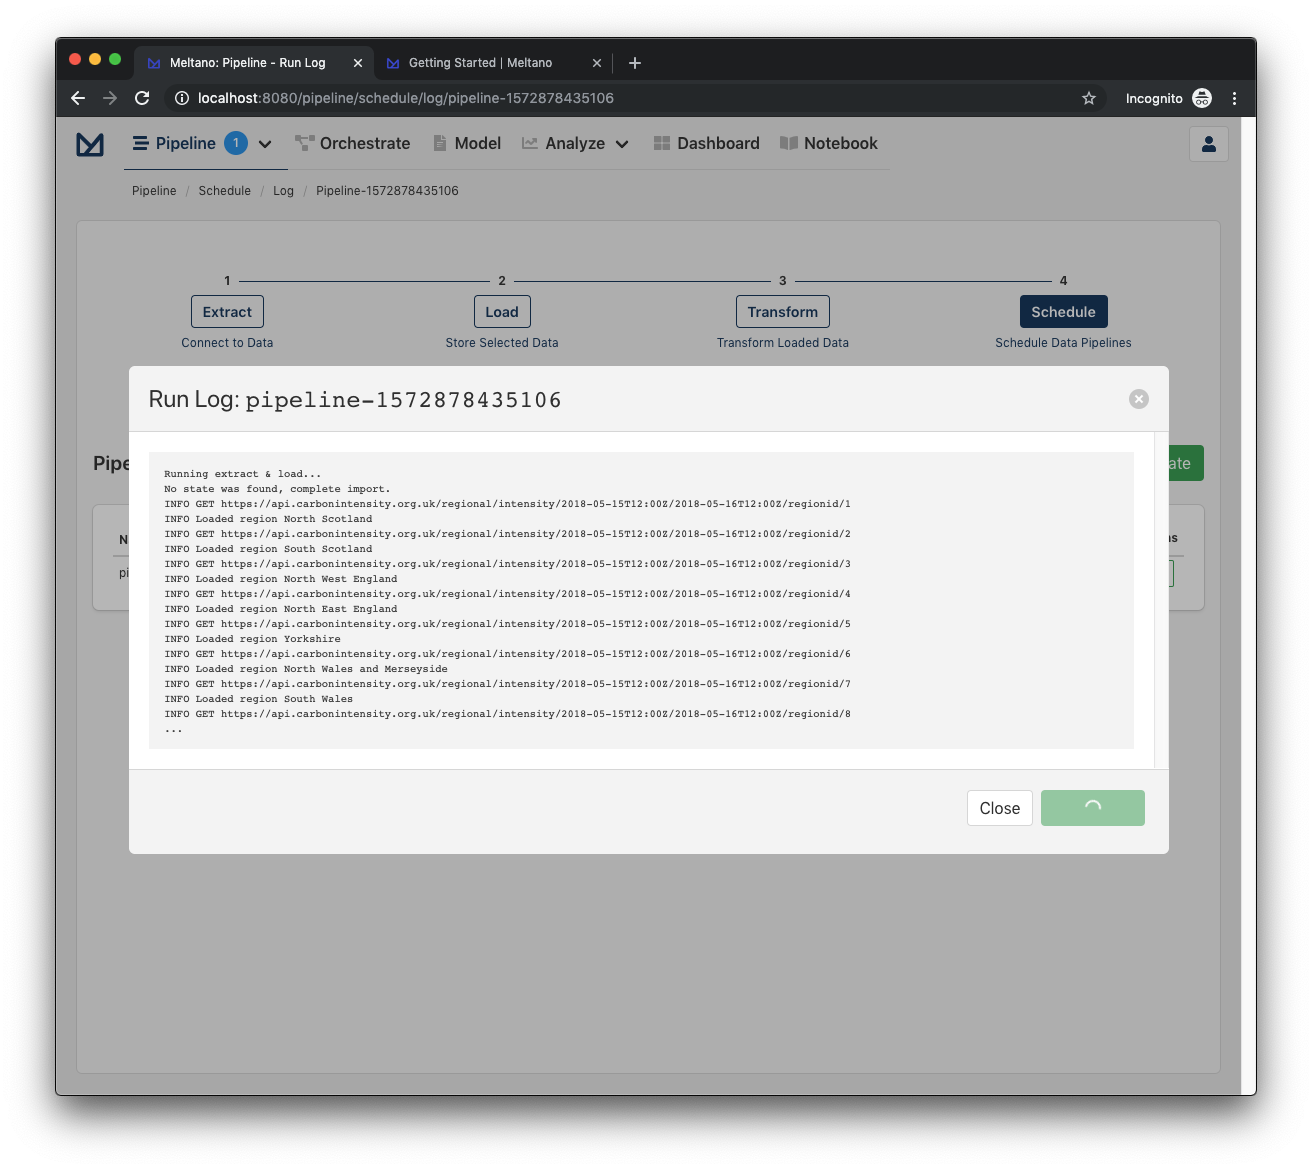
All we need to do is click Save to start our new pipeline! The pipeline's log opens automatically and you can check the pipeline running and what Meltano does behind the scenes to extract and load the data. You should see a spinning icon that indicates that the pipeline is not completed:
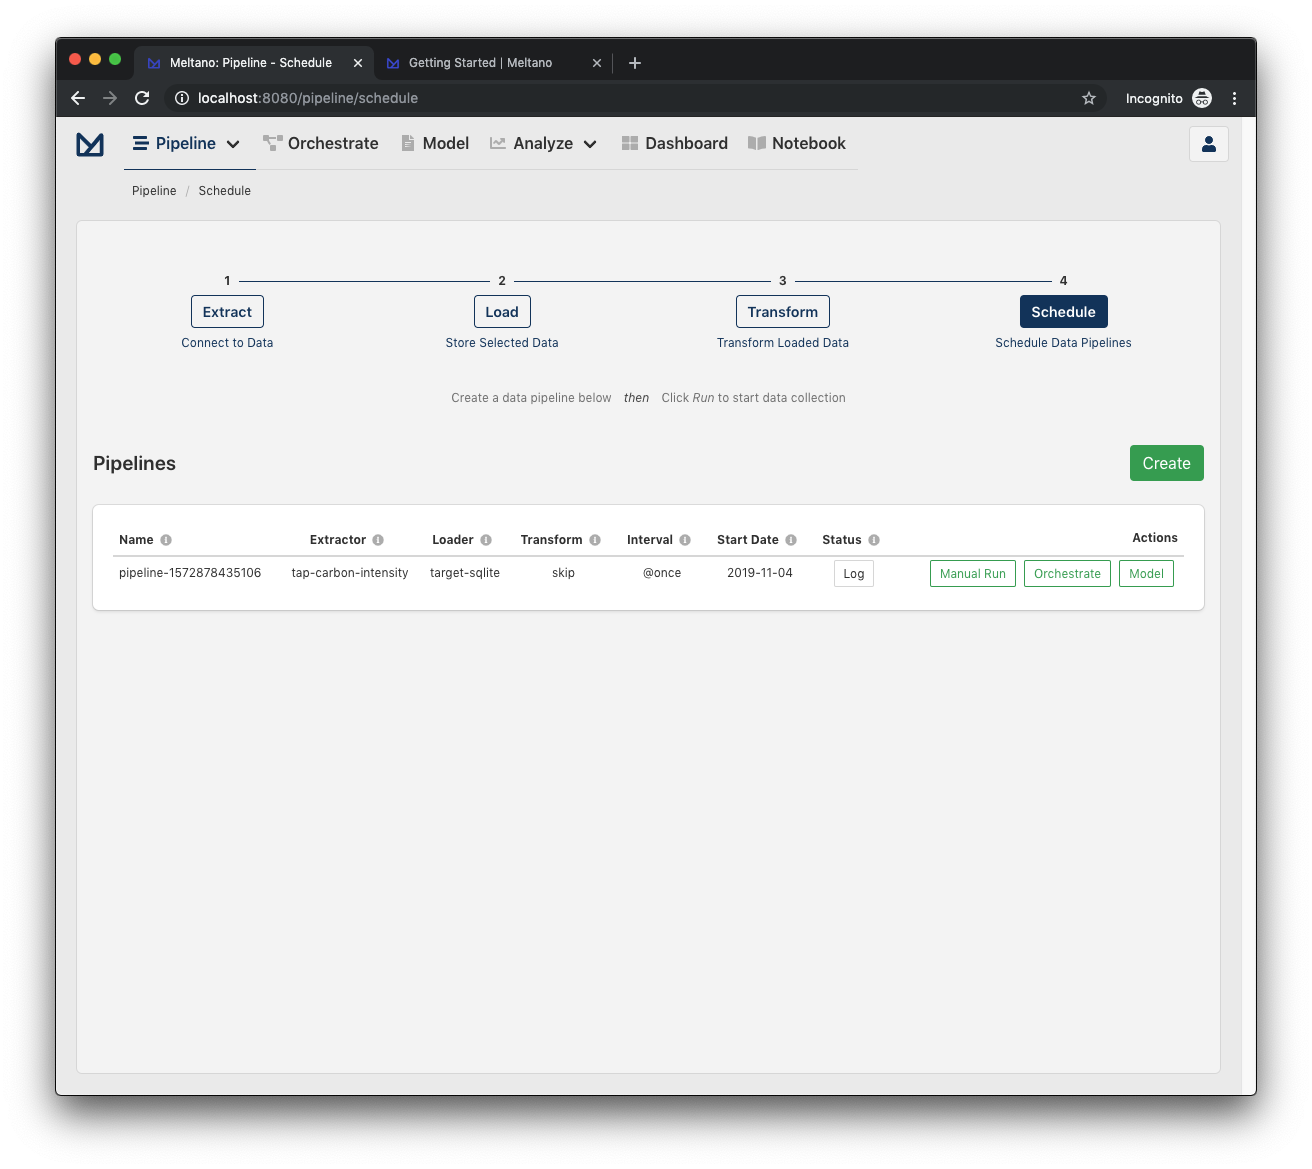
Once it's complete, the indicator will disappear and you should be able to see the final results of the extraction:
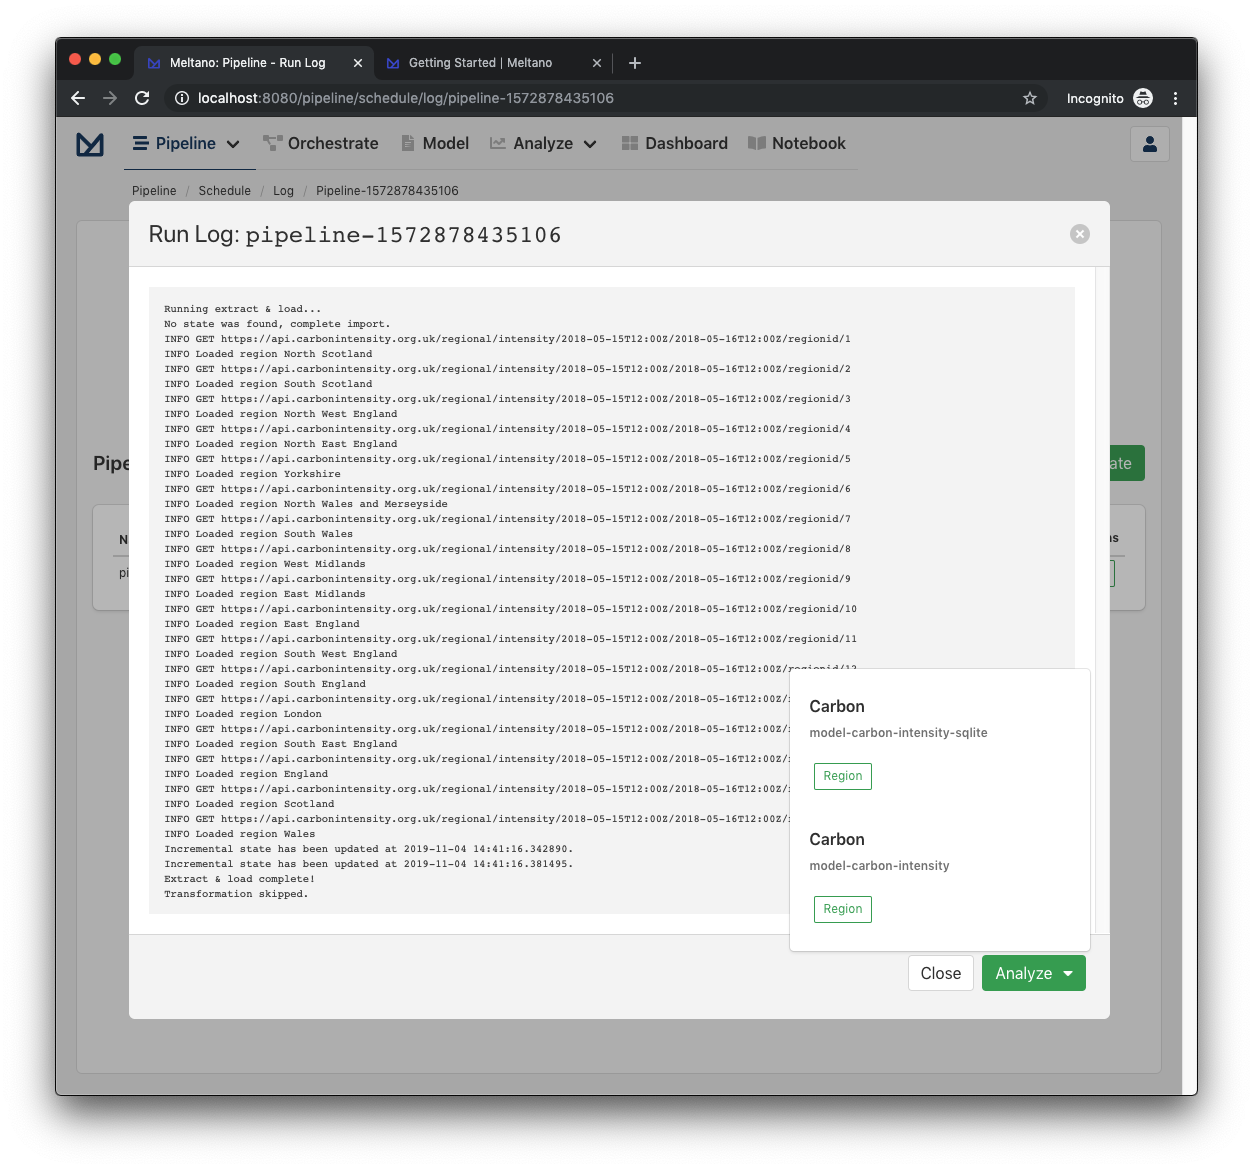
You can click the Analyze button to select a model to analyze or view the same models with more context in the Model page. If you close the log and go back to the Pipelines page you can check the log of any past pipeline by clicking the Log button next to it:
Congratulations! Now that you have connected a data source, configured a target database, and run a successful pipeline for the dataset, we are now ready to analyze the data!
Select a data model
Let's start by clicking on Model in the main navigation:
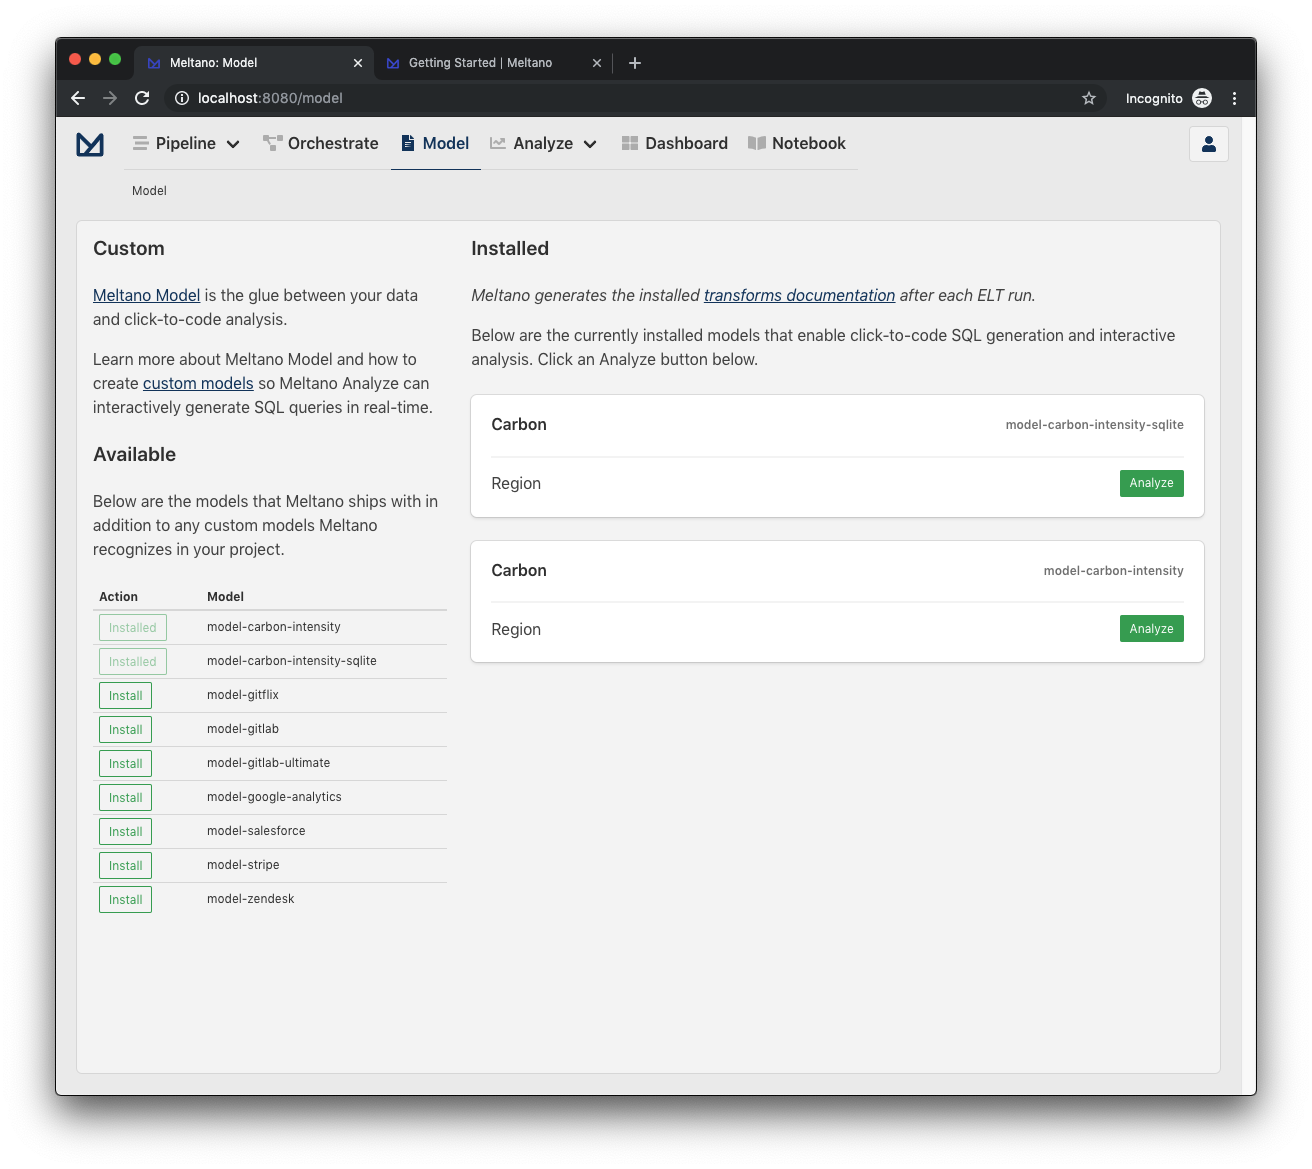
Meltano Models determine how the data is defined and assists us with interactively generating SQL so that you can easily analyze and visualize your data. As you can see in the right column, tap-carbon-intensity already has the required models installed.
Let's move on to the next step by clicking Analyze in the model-carbon-intensity-sqlite card to move on to the next step.
Analyze the data
The Analyze page contains an interactive user interface to allow you to dynamically build queries and visualize your data.
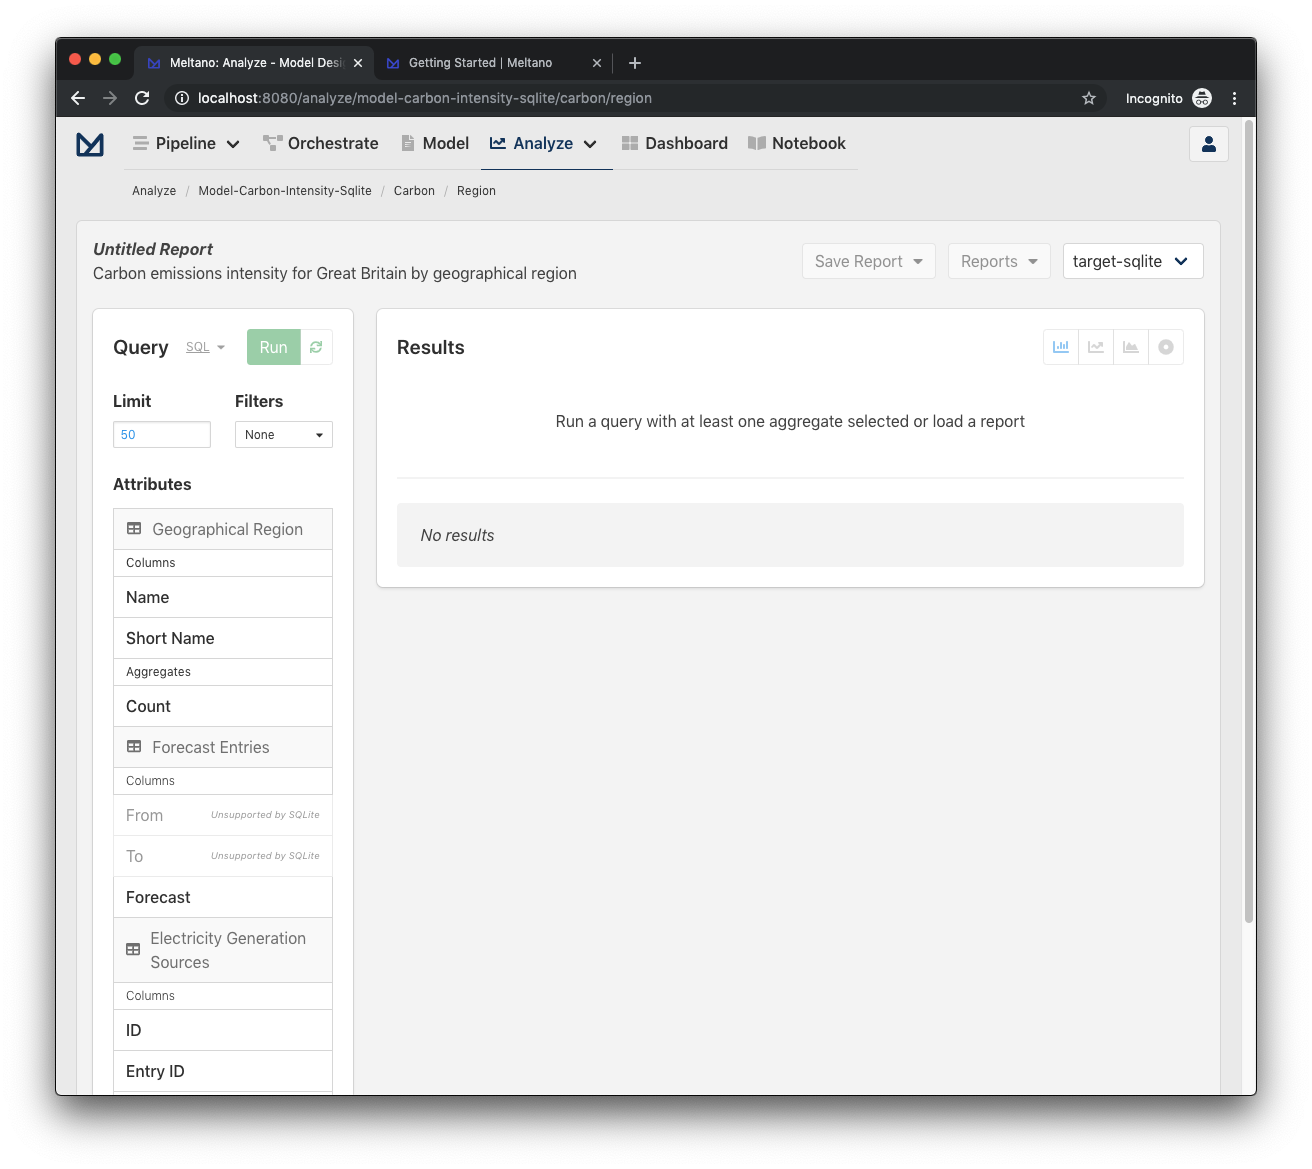
Now, let's explore and analyze our tap-carbon-intensity data by selecting the following attributes in the left column:
- Geographical Region
- Columns: Name
- Aggregates: Count
- Electricity Generation Sources
- Columns: ID
- Aggregates: Average Percent (%)
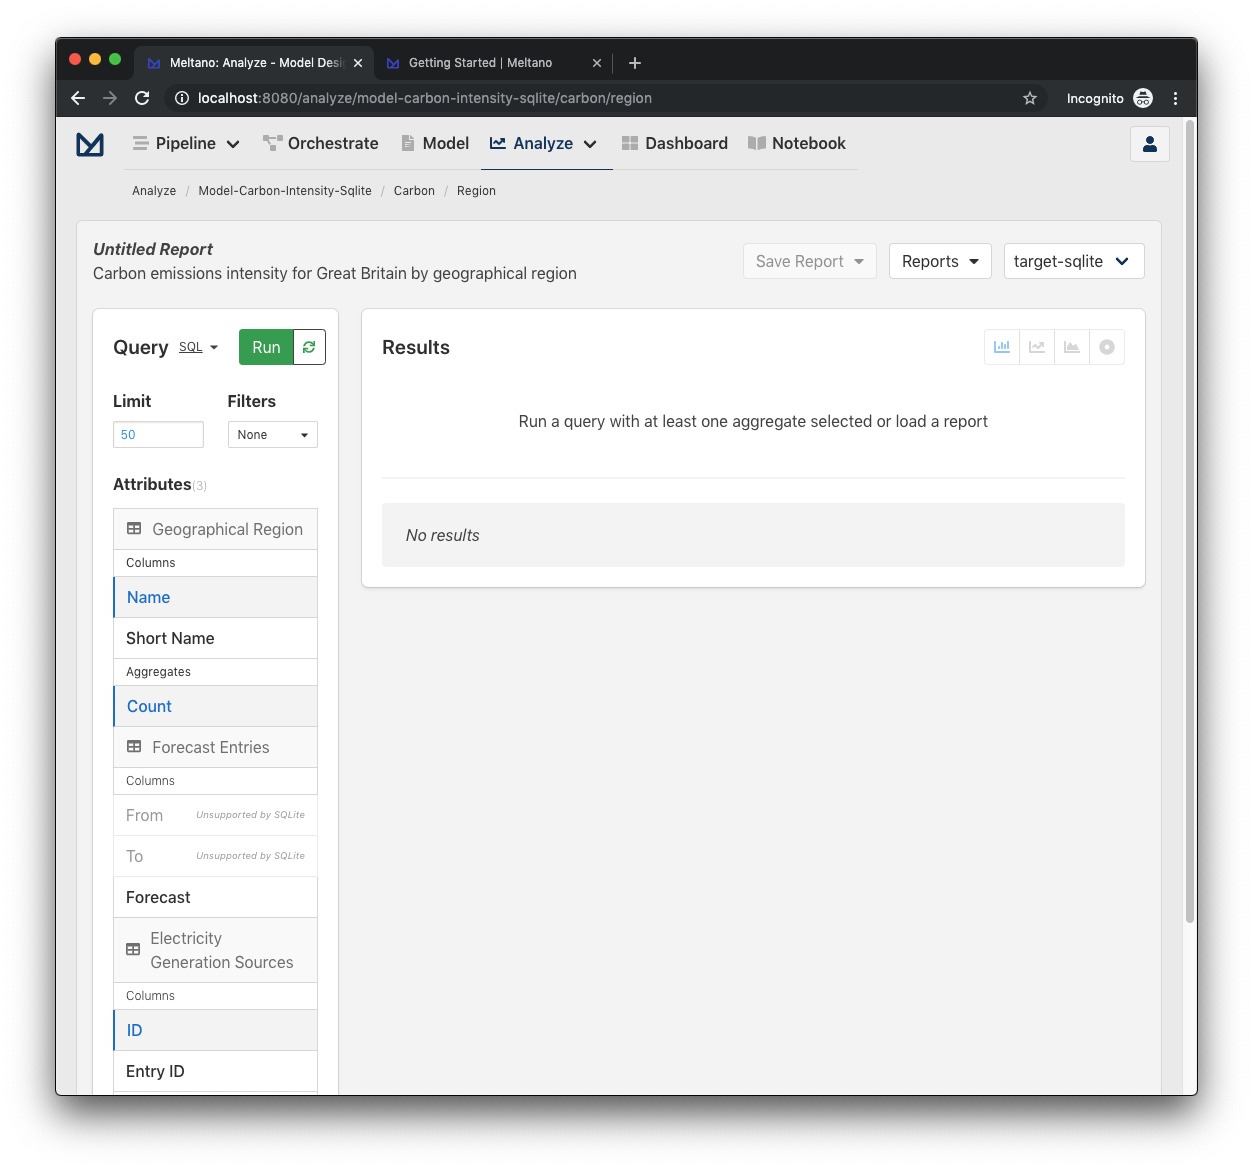
And with that, the big moment is upon us, it's time to click Run to run our query!
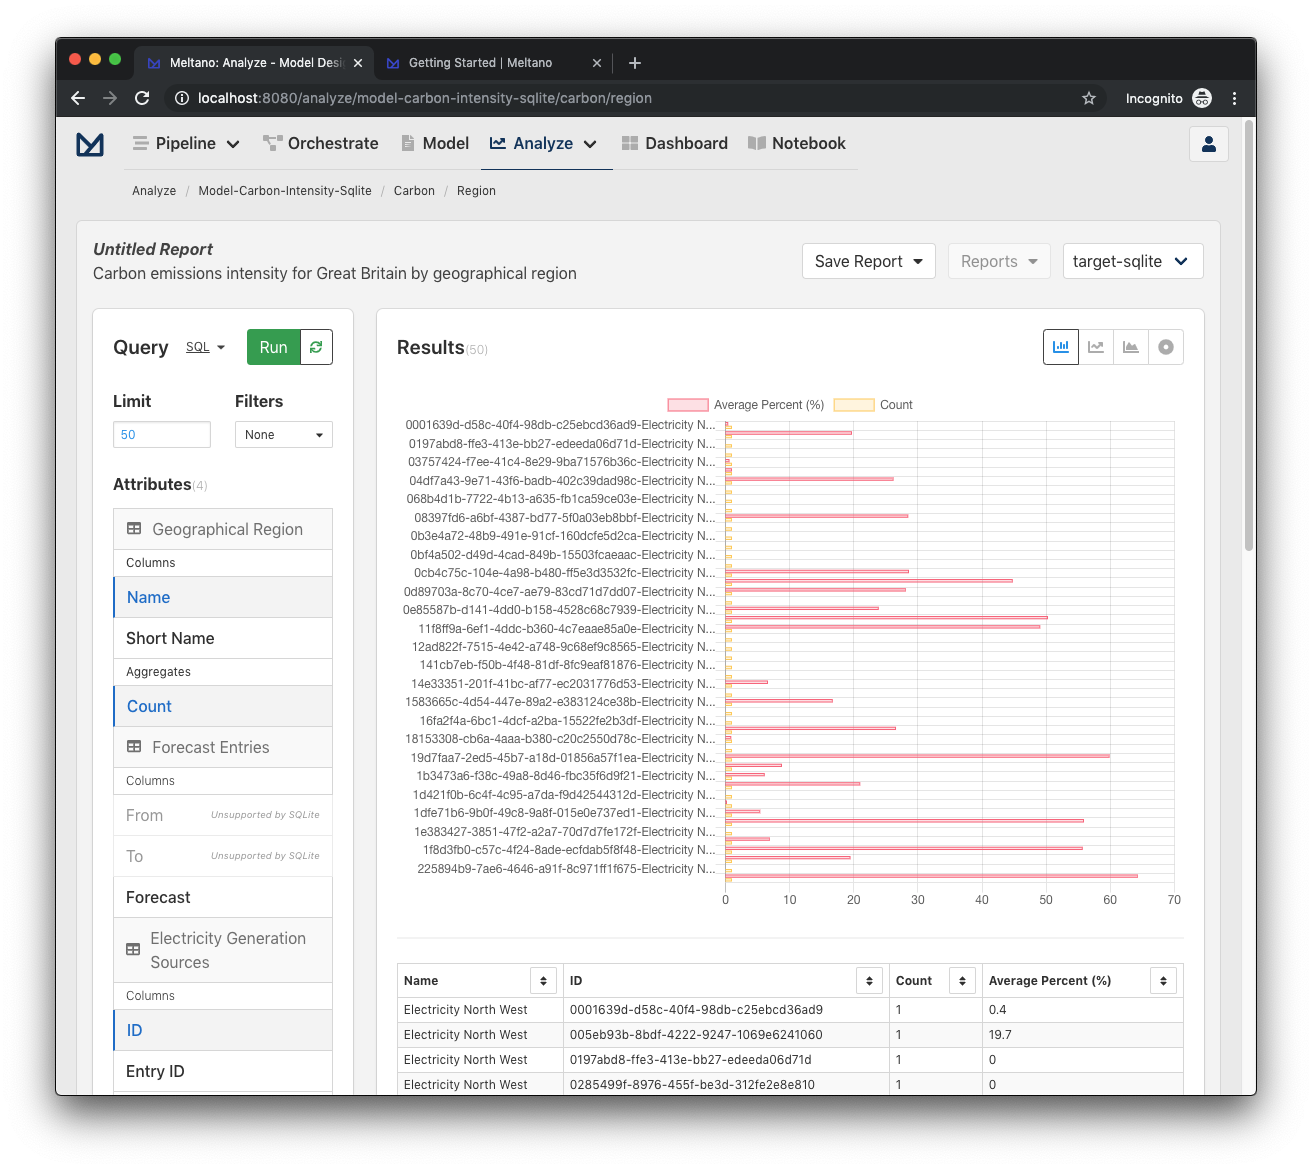
You should now see a beautiful data visualization and a table below to see the data in detail!
Save a report
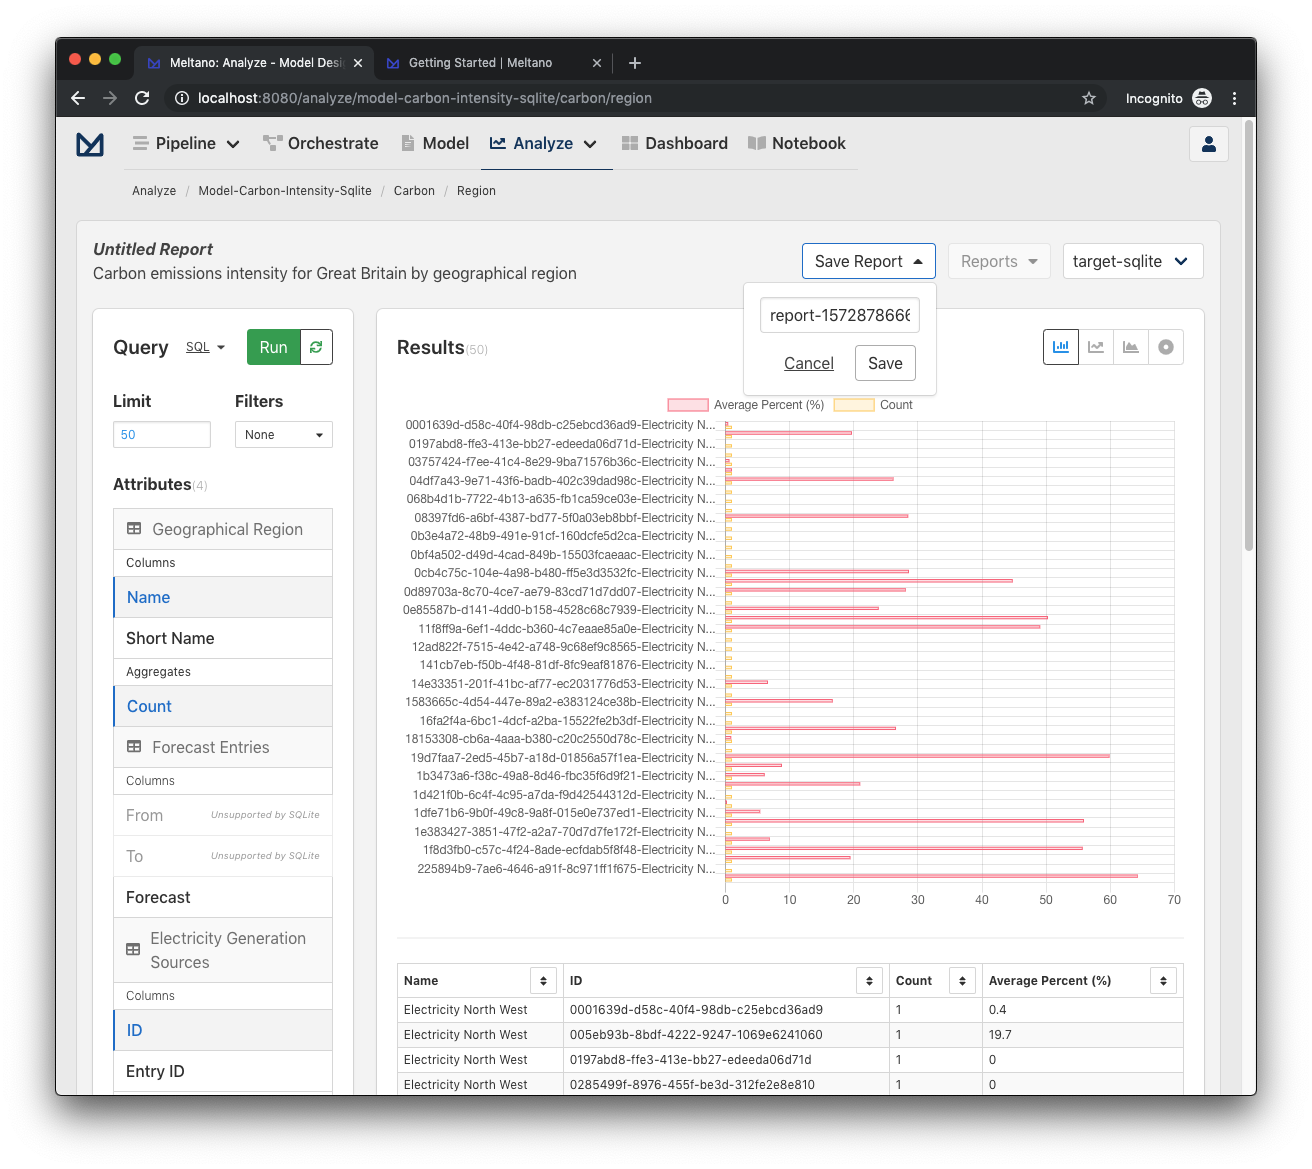
When we find an analysis that we want to reference in the future, we can easily do this by creating a report. This can be accomplished by clicking on the Save Report dropdown in the Analyze toolbar. This will open a dropdown with a default report name that is dynamically populated, but can be easily changed.
Once we click Save, we should see the upper left "Untitled Report" change to our new report name.
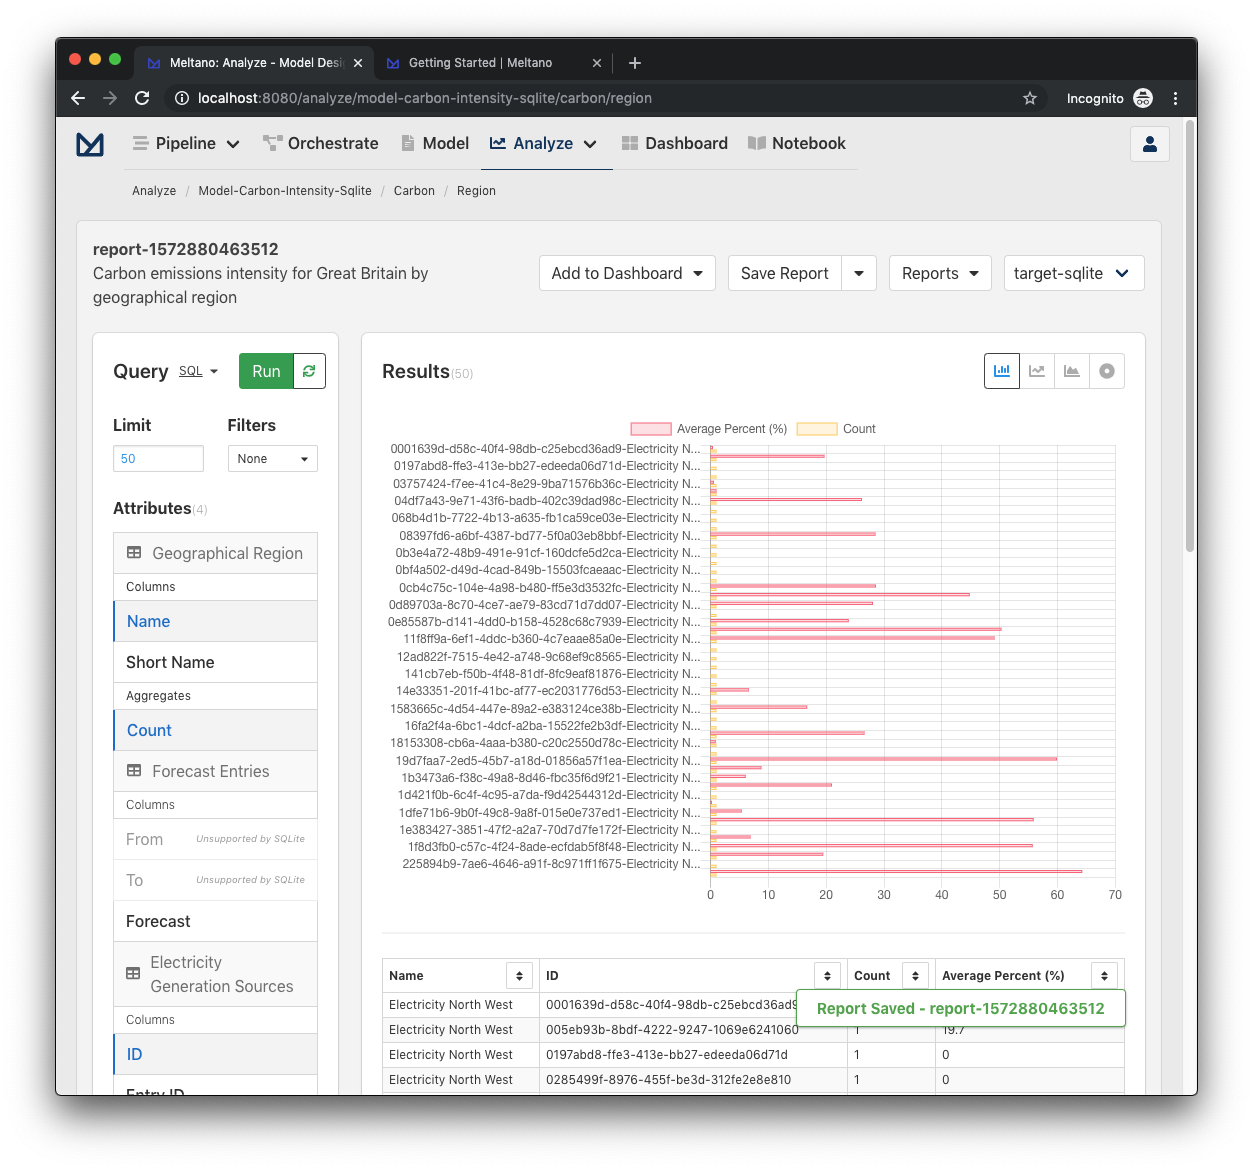
And with that, our analysis has been saved!
Add a report to a dashboard
As you acquire more reports, you will probably want to organize them via dashboards. This can be done by clicking on the new Add to Dashboard dropdown in the toolbar.
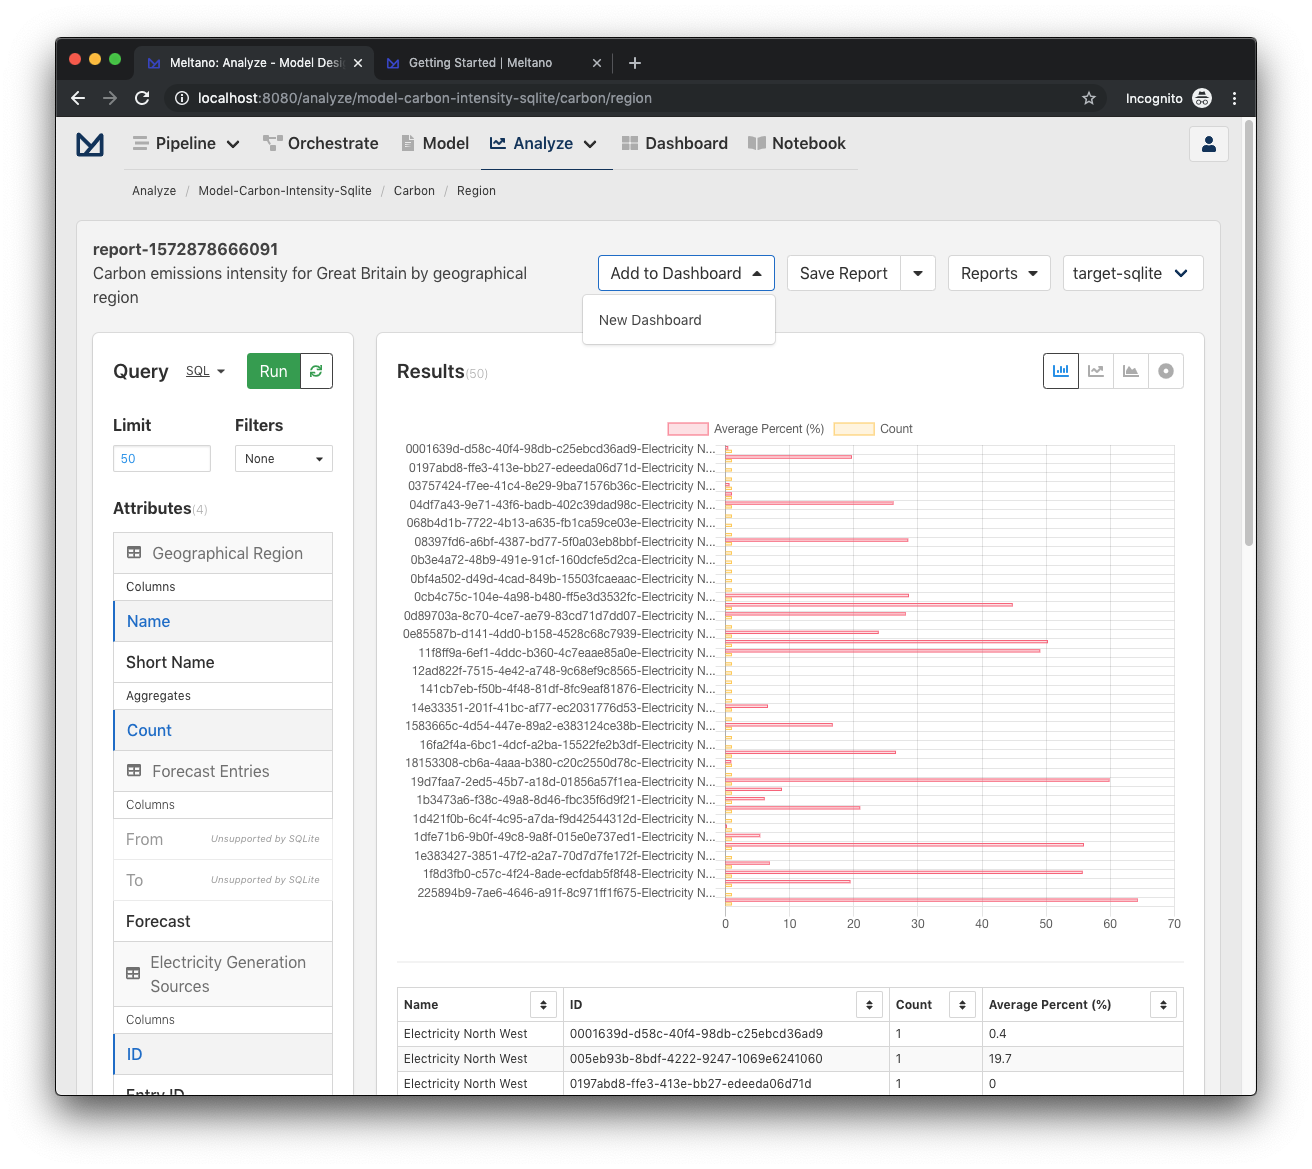
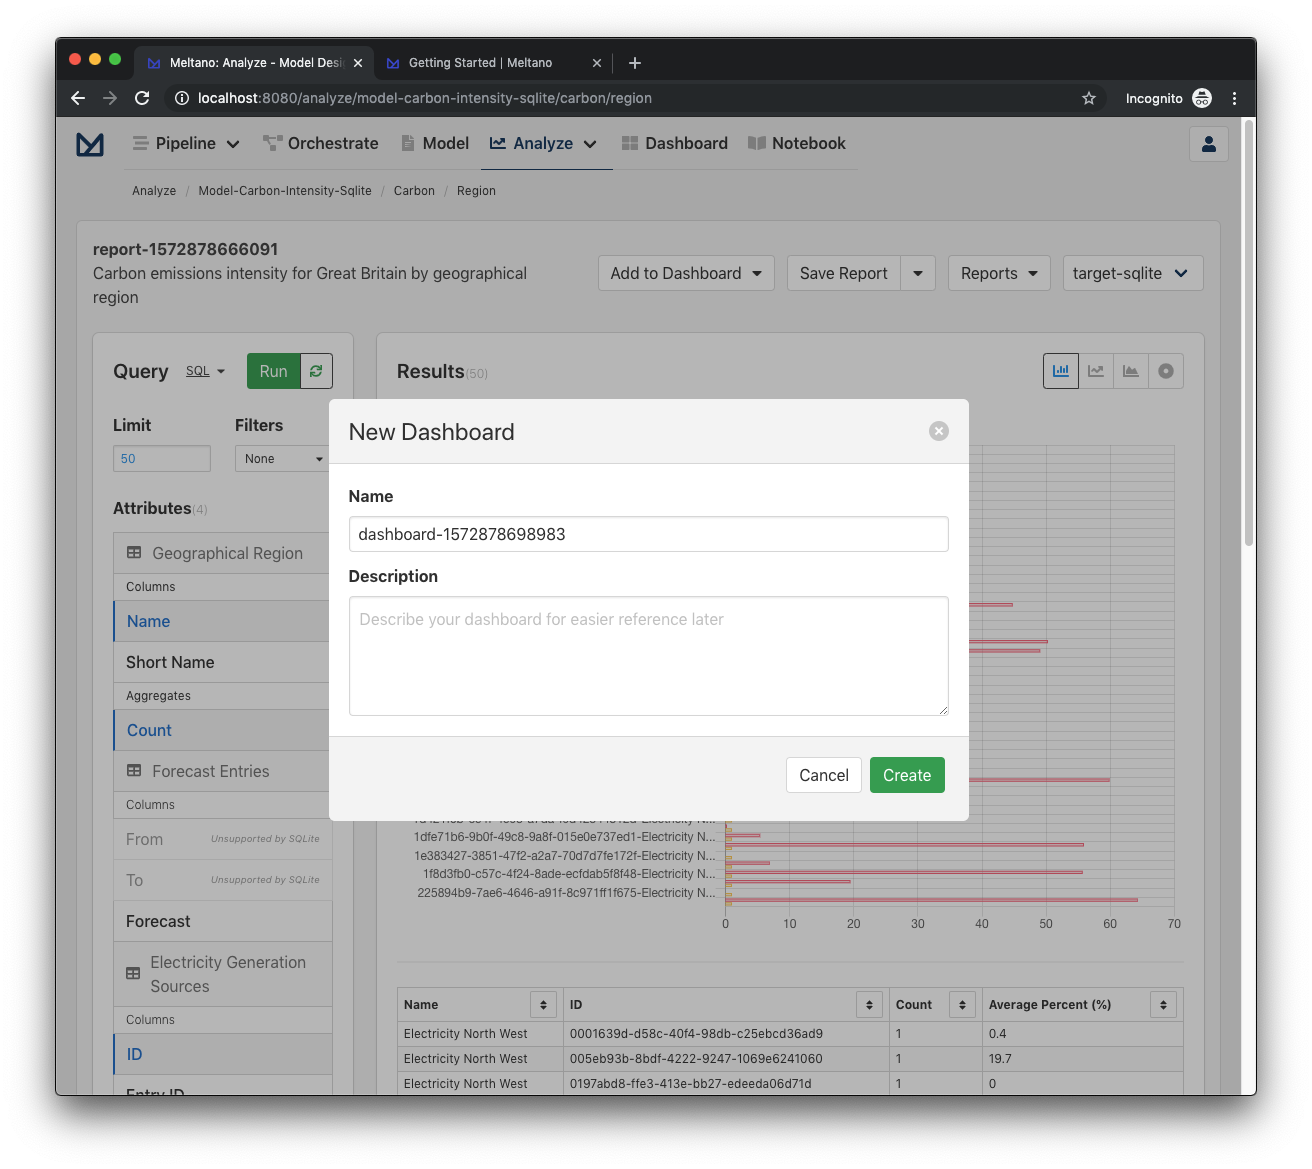
Since we have never created a dashboard, click on New Dashboard, which will trigger a modal that contains a dynamically generated dashboard name that can be customized as desired.
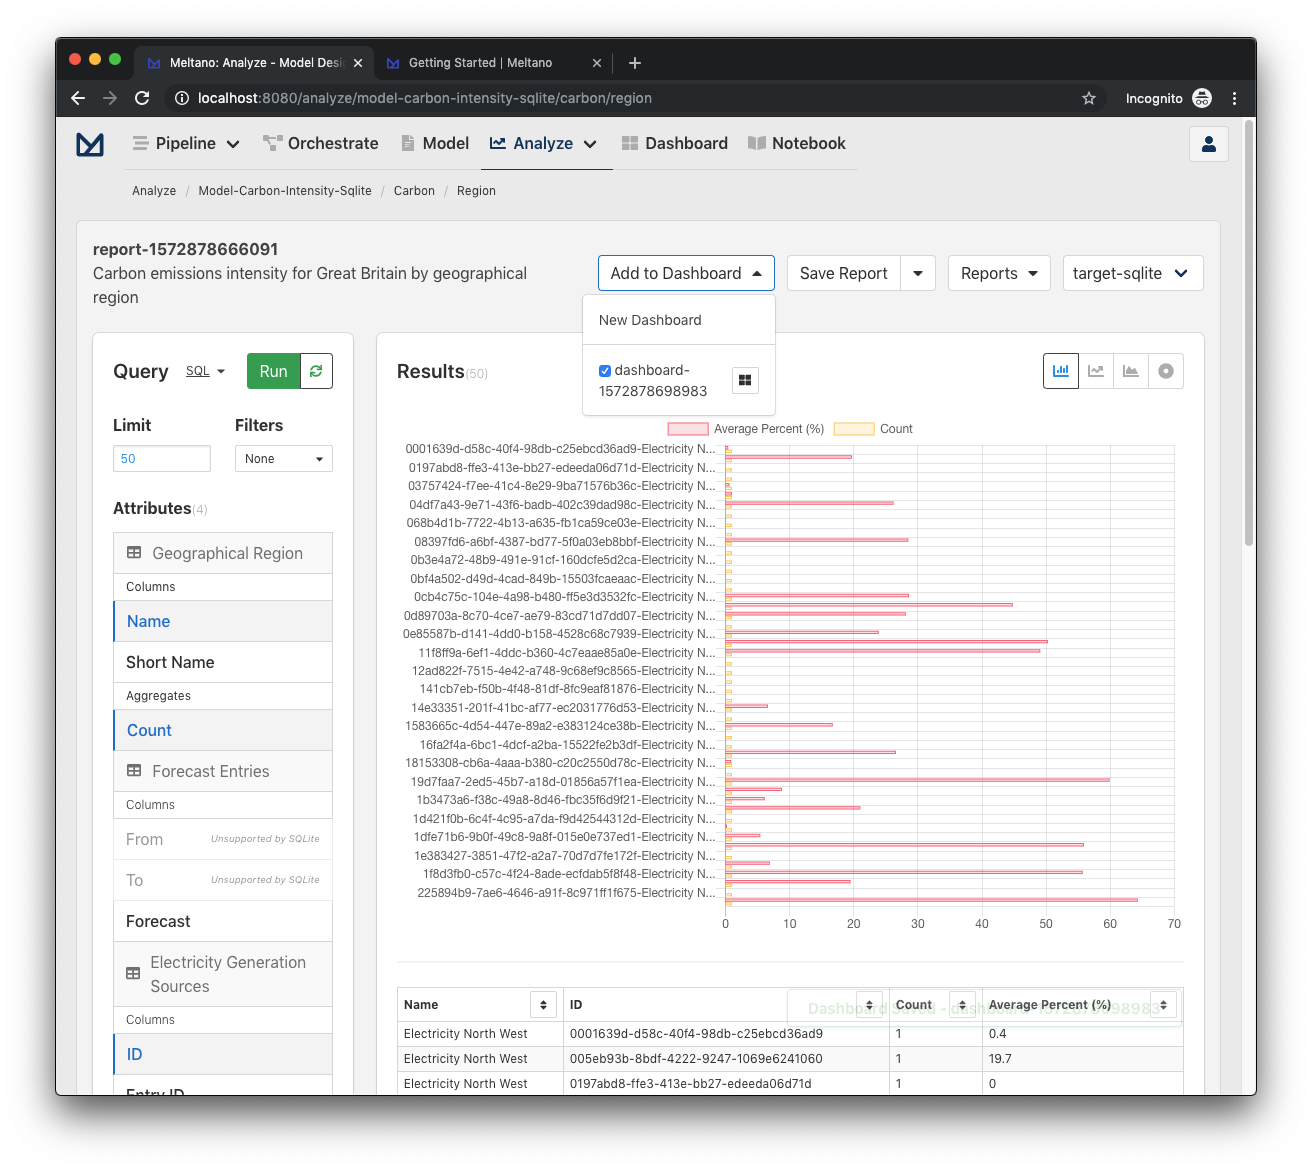
Once we click Create, we can now verify that our report has been added to the Dashboard by clicking on the Add to Dashboard menu.
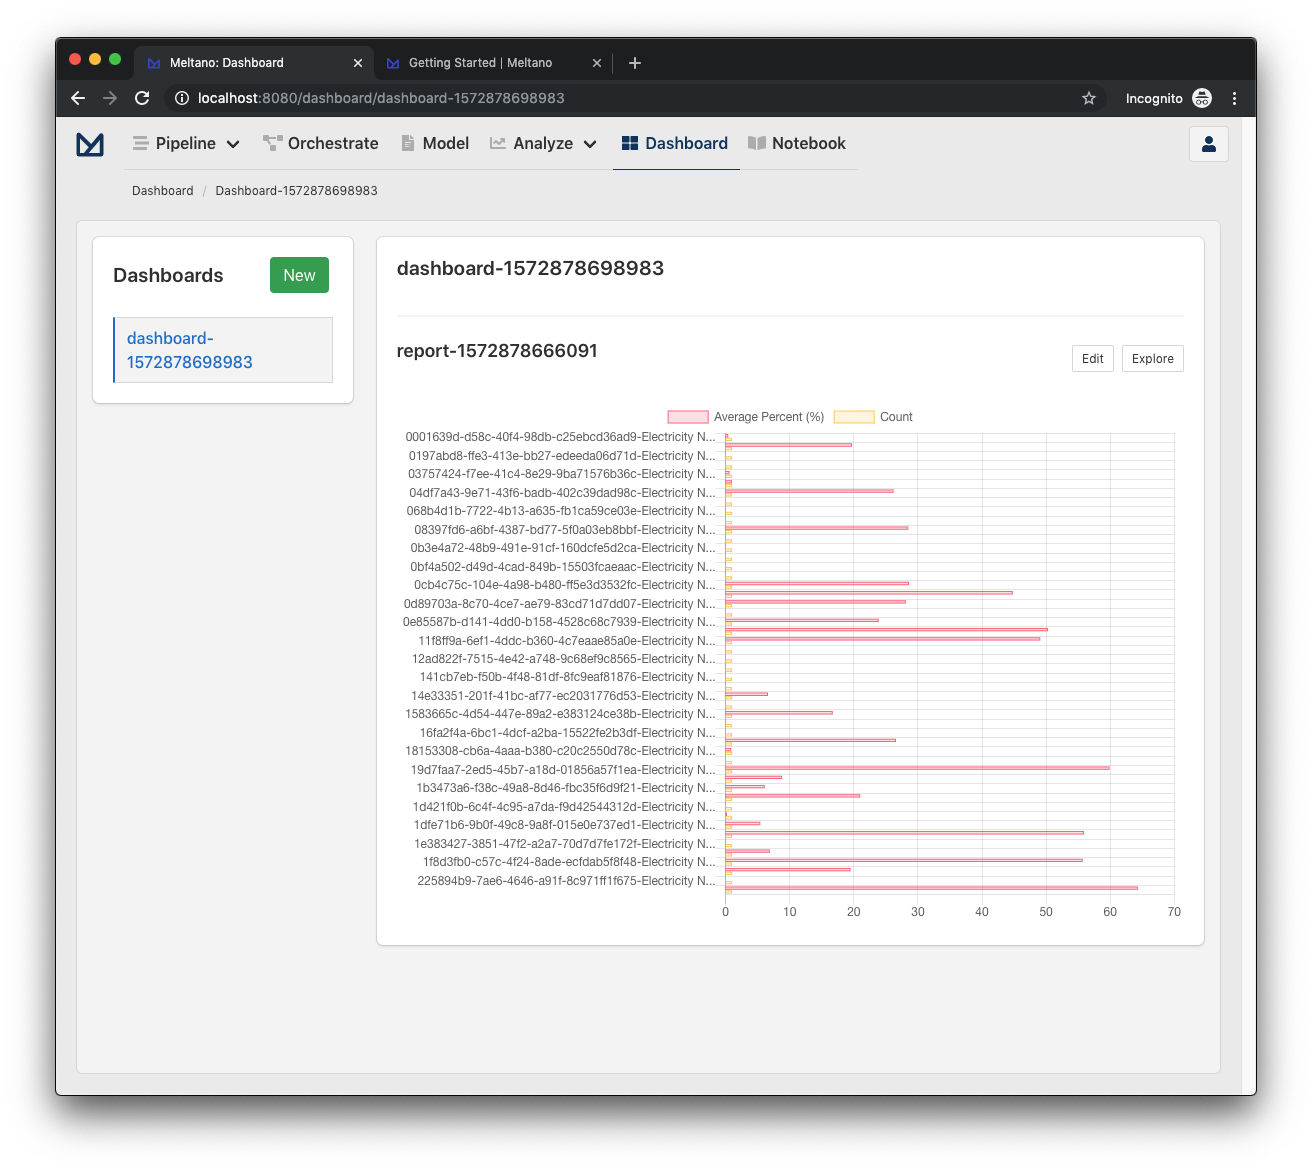
We can also visit the Dashboard directly by clicking on the Dashboard navigation item in the header, which shows our newly created Dashboard and the associated Report.
Next steps
And with that, you have now setup a complete end-to-end data solution with Meltano! 🎉
To learn about more Meltano recipes and functionality with our tutorials.